Transcriptional condensates
Dr. Denes Hnisz
Do you want to know the secrets of your most important genes? Do you like solving puzzles with a creative and collaborative approach? Do you find any aspect of transcription, stem cell, developmental or disease biology particularly interesting?
The mission of the Hnisz laboratory is to discover principles that underlie control of transcriptional programs during development and disease. We recently proposed a model that transcriptional regulatory proteins can form phase-separated ‘transcriptional condensates’ that play important roles in mammalian cells (Hnisz et al., Cell 2017). The central theme of the lab is to use the transcriptional condensate model to solve major outstanding problems in transcription-, developmental- and disease biology. We combine advanced imaging, biochemical, genomic, and computational tools, and work in highly collaborative teams.
Successful candidates will develop projects inspired by the condensate model. For some examples see our recent work on i) the molecular basis of condensate formation: Basu et al, Cell 2020; ii) endogenous retroviruses and condensates: Asimi et al, Nature Genetics 2022; iii) condensate dysregulation in rare genetic diseases: Mensah et al., Nature 2023; and iv) drugging condensate-forming transcriptional regulators: Basu et al., NSMB 2023.
We work closely with several labs at the institute, including the labs of Martin Vingron, Alexander Meissner, Matthew Kraushar, Stefan Mundlos, Daniel Ibrahim, and are open for creative collaborative project ideas with these and other labs.
For more information have a look at the website of the Multi-level Gene Control Group.
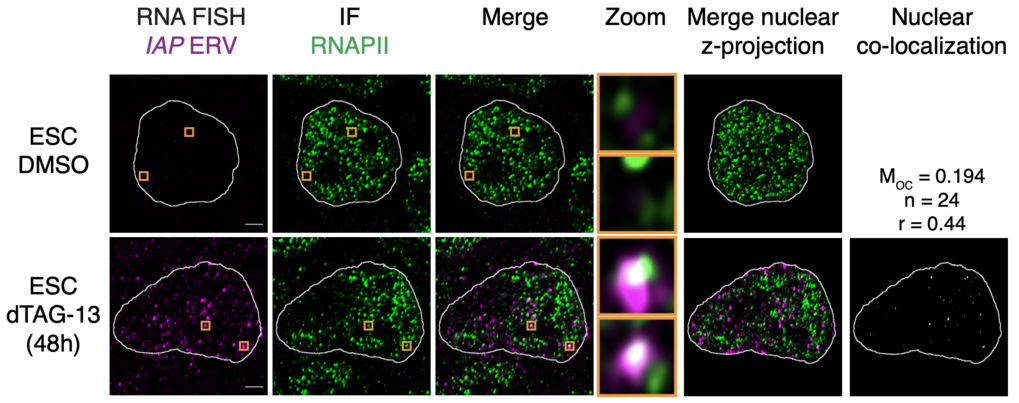
Derepressed IAPs form nuclear foci that associate with RNAPII condensates and incorporate nearby genes. Representative images of individual z-slices (same z) of RNA-FISH and RNAPII IF signal, and an image of the merged channels. The nuclear periphery determined by DAPI staining is highlighted as a white contour. The zoom column displays the region of the images highlighted in a yellow box (enlarged for greater detail). Merge of the nuclear z-projections is displayed, and overlapping pixels between the RNA-FISH and IF channels are highlighted in white. Displayed MOC and Pearson’s correlation coefficient (r) values are an average obtained from 24 analyzed nuclei. Scale bars, 2.5μm.Asimi et al, Nature Genetics 2022


