Nanocourse: Basics of data analysis in flow cytometry
- Fully booked!
- Start: Apr 8, 2025
- End: Apr 9, 2025
- Speaker: Melanie Piédavant-Salomon, Marine Gil
- Location: Max Planck Institute for Molecular Genetics
- Room: Seminar room 4
- Host: Melanie Piédavant-Salomon

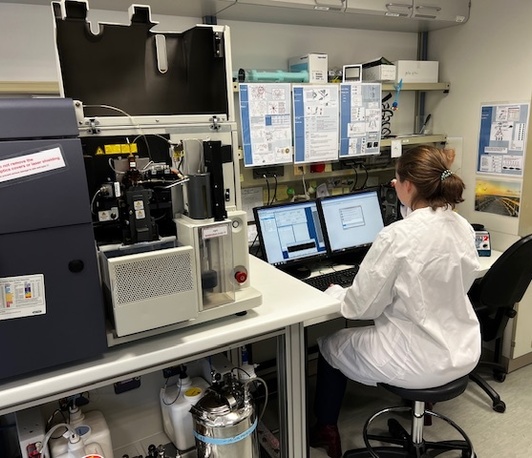
The FACS Facility is offering a 2 day in-house course on "Basics of data analysis in flow cytometry". The course will take you on a journey from flow cytometry raw data to publication-ready figures using FlowJo, GraphPad Prism and Adobe Illustrator - please find the agenda attached.
When? Tuesday, April 8th from 10 AM - 5 PM and Wednesday, April 9th from 10 AM - 3 PM
Where? Seminar Room 4
Seats are limited, please sign up until Monday, March 31st using the following link: https://nc.molgen.mpg.de/cloud/index.php/apps/forms/PYXABqpgwmADMeaD
If you have any questions regarding the course content or if it's suitable for you, please don't hesitate to contact us at facs@molgen.mpg.de
Program
Session 1: Introduction and core pinciples
- Basics of flow cytometry data
- Overview of flow cytometry data structure (FCS files)
- Key concepts: fluorescence intensity, compensation and data scaling
- Introduction to gating strategies
- Data acquisition and quality control
- Importance of experimental controls (antibody titration, FMO, isotype, unstained and single-stain controls)
- Strategies for assessing data quality (e.g. checking for clogs, fluorescence spillover)
Sessions 2 and 3: Using FlowJo for analysis of flow cytometry data
- Data processing
- Uploading and visualizing data in FlowJo
- Compensation: Why it’s needed and how to perform it.
- Data transformation: Linear vs. logarithmic scales, biexponential transformation
- Gating strategies and subpopulation identification
- Step-by-step guide to creating hierarchical gates
- Strategies for identifying rare populations
- Avoiding common pitfalls in gating (doublet discrimination, dead cell exclusion)
- Statistical analysis and data visualization
- Overview of basic statistical methods for flow cytometry
- Visualization techniques: Histograms, scatter plots, density plots
- Best practices for reproducible figures for publication
- Intro to FlowJo plugins (stain index, cell cycle, proliferation)Flow Cytometry Service Facility
Session 4: Reporting your flow cytometry results in publications
- Statistical analysis and data visualization
- Exporting statistics from FlowJo
- Displaying and interpreting data in GraphPad Prism
- Creating publication-ready plots from FACSDiva
- Material and methods – data annotation
- How to report your findings in publications
- Which graphs and gating strategies need to be shown
- How to report the method in publications
- Interpreting results and troubleshooting common issues
Before signing up for this nanocourse, please make sure that you can attend all the dates and write them in your calendar. If you do not show up or cancel at very short notice, other interested students will not be able to participate.